Property Management
Vacation Rental Metrics To Track for Success
Vacation rental metrics can help you answer important questions about your property’s performance. Find out which KPIs you need to track.

Success in the vacation rental industry comes down to using reliable data to make smarter decisions. Whether you manage a single listing or a growing portfolio, tracking your business performance is as important as attracting guests and increasing bookings. By monitoring the right vacation rental metrics, you can identify areas for improvement and adapt your business strategy to maximize revenue.
As a vacation rental host, you're juggling a lot of numbers—nightly rates, occupancy rates, operating costs, and more. But which ones really matter? Which KPIs do actually tell you whether your STR business is becoming healthier and better positioned to grow?
In this blog, we’ll cover the most important metrics every vacation rental host should track, how to calculate them, and how tracking them consistently helps turn data into better decisions and grow your business with confidence.
Why Vacation Rental Metrics Matter
Running a vacation rental without tracking your performance metrics is like flying blind. You need accurate, measurable data to understand how your business is doing and to create an effective revenue management strategy.
Vacation rental analytics offers insight into your property’s performance and profitability, helping uncover weaknesses and discover its true potential. Vacation rental metrics work together to give you a complete picture of your business health and help you spot opportunities that you might otherwise miss.
Tracking your key performance indicators (KPIs) consistently helps turn data into better pricing, marketing, and investment decisions that actually improve your bottom line. This allows you to take steps to make your vacation rental pay for itself and grow a sustainable business.
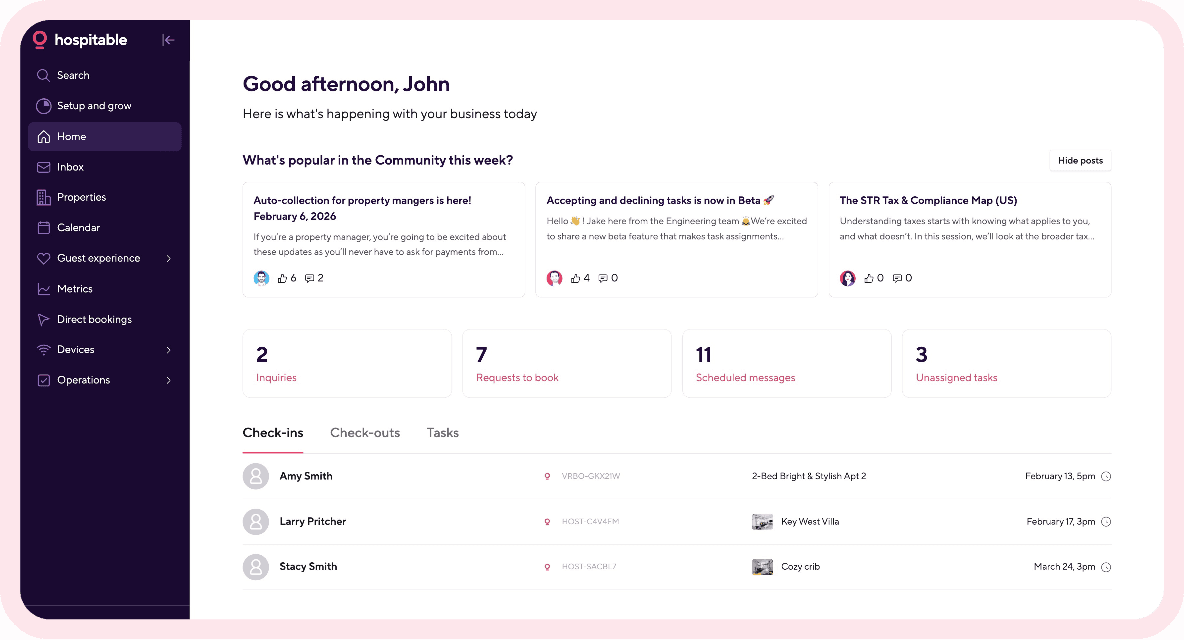
You’ll scale faster by streamlining your operations with short-term rental software like Hospitable, which offers a wealth of advanced features and AI-powered tools. Our STR super app can help you automate 90% of routine hosting tasks, giving you more time to focus on strategic growth.
Essential Vacation Rental Metrics You Should Monitor Regularly
Let’s take a closer look at key vacation rental metrics that can help you track your property’s performance and make decisions that boost your success.
Occupancy rate
The occupancy rate of your vacation rental is the percentage of available nights that are actually booked over a specified period. You can calculate it by dividing the number of booked nights by the number of available nights, then multiplying by 100. For example, if your vacation rental has been booked for 15 out of 30 days in a month, then your occupancy rate for that month is 50%.
Tracking the occupancy rate can help you gauge how well you're filling your calendar, identify listings that need attention, and understand seasonal trends. A low occupancy rate may indicate that you need to improve your marketing efforts, optimize your listing, or adjust pricing to attract more guests. On the other hand, a consistently high occupancy rate may indicate underpricing, suggesting an opportunity to increase your nightly rate.
Occupancy rate is a critical metric that helps you understand how appealing your vacation rental is to potential guests and gauge the consistency of generated income. And with Hospitable’s Copilot, getting real-time insights about occupancy rate and other metrics is as easy as asking a question.
Copilot is a built-in AI assistant designed to help you quickly access insights, analyze the performance of your properties, and manage them more efficiently. Copilot has access to your Hospitable account data so that you can ask it about anything related to your vacation rental business, and it will provide relevant information, saving you time.
Average daily rate
Average daily rate (ADR) calculates the average revenue earned per booked night. It measures your pricing power and is a core metric for assessing a property’s profitability. You can calculate the ADR by dividing the total revenue received from your bookings for a specific property by the total number of booked nights. For example, if you generated $3,000 from 20 booked nights, your ADR is $150.
ADR helps you compare your nightly rates to others in your area. It lets you see whether you're leaving money on the table or pricing yourself out of the market, so you can make informed decisions about your pricing strategies.
RevPAR
RevPAR is short for Revenue Per Available Room. It combines occupancy and ADR into a single figure and is a critical KPI for measuring revenue performance. RevPAR measures overall property profitability for every single night, no matter whether it was booked or not.
You can calculate RevPAR by multiplying your average daily rate by your occupancy rate, or by dividing total revenue by the number of nights in a given period. For example, if your ADR is $150 and your occupancy rate is 60%, your RevPAR is $90.
RevPAR helps you measure the success of your vacation rental property, providing a balanced view of performance and showing your true earning potential. It allows you to determine whether nightly rates and occupancy are balanced to maximize revenue.
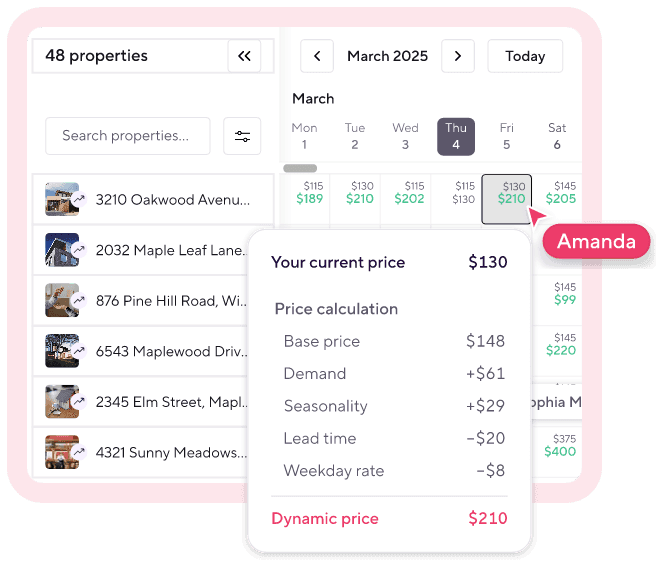
You can optimize your RevPAR by implementing a dynamic pricing strategy that aligns with market supply and demand trends. Set low rates during slow seasons to boost occupancy and high rates during peak periods to maximize ADR.
The good news is that Hospitable comes with a built-in Dynamic Pricing solution, so you don’t need extra tools to get your pricing right. If you enable Hospitable’s Dynamic Pricing for your property, Hospitable will automatically adjust your nightly rates based on demand, competition, seasonality, and other factors to help maximize revenue while maintaining healthy occupancy.
Average length of stay
This metric shows the average number of nights guests typically stay during a reservation. You can calculate it by dividing the total number of booked nights for the month by the total number of bookings. For example, a month with 30 booked nights across 10 bookings has an average length of stay of 3 nights.
This metric matters because it shows how long people stay in your rental and how that varies by season. Keep in mind that longer stays reduce turnover costs and increase revenue stability, while shorter stays may boost occupancy but increase cleaning and maintenance costs and admin work.
Net operating income
The net operating income (NOI) is the total revenue generated by a vacation rental property after you have deducted its operating expenses. Your total revenue includes nightly rates, cleaning fees, and pet fees that your guests pay, as well as any additional guest services, such as concierge offerings. Operating expenses typically include cleaning, maintenance, utilities, supplies that you stock for your guests, marketing, property management automation, taxes, etc.
NOI is the central measure of property-level profitability because it directly reflects the income remaining after covering all operating expenses. NOI analysis can reveal where ongoing operational costs are eating into profits and help identify operational inefficiencies.
Revenue per property
This metric shows total revenue per listing over a period. If you manage multiple vacation rentals, tracking revenue per property can help you determine which properties are the most cost-effective. You can calculate it by dividing your gross rental revenue for the specific period by the total number of your vacation rentals.
Total revenue for all your vacation rentals
It’s the amount of money generated by all your vacation rental properties during a specific period. This metric can help you estimate your portfolio’s potential future earnings. To calculate your total revenue, you need to add all the costs your guests paid, including nightly rates, cleaning fees, pet fees, add-on services, etc.
Revenue per channel
If you list your vacation rental on multiple OTAs, such as Airbnb, Vrbo, and Booking.com, and also have your direct booking website, it’s essential to track your rental revenue per channel. Remember that the channel that drives the most bookings is often not the one that drives the most profitable revenue.
Managing listings on multiple platforms requires time and effort. By analyzing the data on the revenue generated by each of your booking channels, you can find out which of them performs best. This will help you make informed decisions and allocate your time more effectively.
Successful vacation rental hosts don’t necessarily have the nicest properties. One thing that they have in common is that they use technology to get actionable insights from their data and make smarter decisions. All-in-one short-term rental property management software with analytics, like Hospitable, offers integrated dashboards and reporting tools, making it easier to track performance metrics and gather meaningful insights across different aspects of your business.
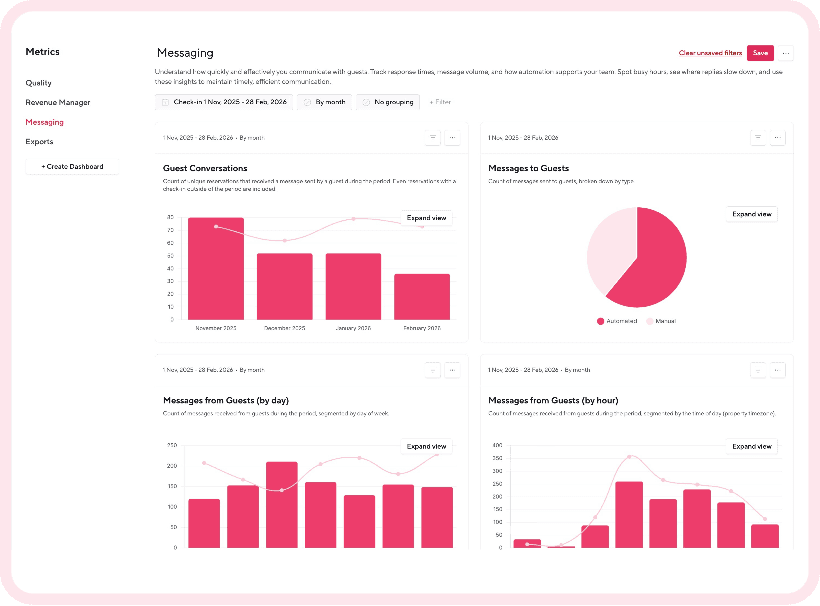
With Hospitable’s Metrics, you can see your entire portfolio performance in real time. You can build your own fully custom dashboards to track the metrics that matter to you, add pre-built widgets from a searchable library, save configurations for recurring analysis, and share it with stakeholders who don’t have a Hospitable account.
Inquiry-to-booking conversion rate
You may get a lot of inquiries from potential guests, but they are useless if you don’t get any bookings. Your occupancy rates drop, and your bottom line suffers.
A low inquiry-to-booking conversion rate could mean that you take too long to respond to guest messages or that your vacation rental doesn’t meet travelers’ expectations. You can calculate this important metric by dividing the number of confirmed bookings by the number of distinct inquiries you received.
Average response time to an inquiry
Major OTAs measure how well you communicate. They track response time and response rate and encourage hosts to respond to guest inquiries within 24 hours. Still, it’s better to respond to your potential guests as soon as possible to ensure a pleasant booking experience and build trust. You can calculate your average response time to an inquiry if you add up the time it took to respond to all your different inquiries and divide it by the total number of inquiries.
Most guests don’t contact just one property. They message a few hosts at once, ask similar questions, and the first host who provides a clear, helpful response often secures the booking. That means you need a system that ensures you reply first.
You’ll be able to reply to booking inquiries and other guest messages faster if you use Hospitable to automate guest communication. With Hospitable, you can send pre-programmed messages at the key moments in their journey, let the AI handle routine questions, and use Inbox AI tools to generate detailed, personalized replies to tricky guest questions while you sleep.

Tracking Vacation Rental Metrics: Custom Dashboards with MCP
Hospitable gives you advanced built-in tools to track all key vacation rental metrics and get a full picture of your properties’ performance. But with the Hospitable MCP server, you get the complete freedom to visualize your business data however you want.
Just connect an AI agent like ChatGPT or Claude to your account to give it secure access to data from all your connected channels, and describe in plain English the dashboard you want to create to visualize your KPIs. Your AI will retrieve and analyze relevant data, then build a custom dashboard with the numbers that matter to you.
For example, you can display a single live KPI full screen, create a multi-page executive report with metrics you care about, or build an interactive operational dashboard where each problem cell provides a recommendation on what to do next. You may check our blog on property management data analytics for specific examples.
Final Thought
By regularly monitoring and analyzing key vacation rental metrics, you can gain actionable insights into your business performance. They can help you identify where you might be losing money and where you could be making more, so you can make data-driven decisions that contribute to your business success.



Table of contents
Common questions
What are the most important vacation rental metrics to track?
The most important vacation rental metrics include occupancy rate, average daily rate (ADR), RevPAR, average length of stay, net operating income (NOI), revenue per property, total portfolio revenue, revenue per booking channel, inquiry-to-booking conversion rate, and average response time. Together, these KPIs show how well a property is filling its calendar, how effectively it is priced, how profitable it is, and where operational or marketing improvements may be needed.
How do you calculate vacation rental occupancy rate?
Vacation rental occupancy rate is calculated by dividing the number of booked nights by the number of available nights for a given period and multiplying by 100. For example, if a property is booked for 15 out of 30 available nights, its occupancy rate is 50%.
What is RevPAR and why does it matter for vacation rentals?
RevPAR, or Revenue Per Available Room, measures revenue performance across all available nights, whether they were booked or not. It can be calculated by multiplying ADR by occupancy rate or by dividing total revenue by the number of available nights. Because it combines pricing and occupancy in one metric, RevPAR helps show whether a vacation rental is balancing nightly rates and booked nights effectively.
What is net operating income for a vacation rental?
Net operating income is the revenue a vacation rental generates after operating expenses are deducted. Revenue can include nightly rates, cleaning fees, pet fees, and additional guest services, while operating expenses can include cleaning, maintenance, utilities, supplies, marketing, property management automation, and taxes. NOI is a key measure of property-level profitability because it shows how much income remains after ongoing operating costs.
Why should you track revenue by booking channel?
Tracking revenue by booking channel shows which sources—such as Airbnb, Vrbo, Booking.com, or direct bookings—generate the most valuable business. The channel producing the most reservations is not always the one producing the most profitable revenue, so comparing channel performance can help hosts decide where to focus their time, marketing, and distribution efforts.