OTAs
Airbnb Analytics Tools You Can Use to Maximize Your Revenue
Find out how to use Airbnb analytics and market intelligence tools to gather and analyze accurate data to help you build a successful Airbnb strategy and boost your short-term rental profits.

Whether considering investing in real estate or owning an Airbnb rental, you can’t base your business decisions on intuition, luck, or guesswork. It’s too risky. To achieve maximum profits on your STR property, it is essential to rely on a comprehensive analysis of real-time data and actionable insights from reliable sources.
That means you should take advantage of market intelligence tools that can help you find the best cities for Airbnb investment and assess the profitability of investment properties. Some tools can help Airbnb hosts track their performance and optimize pricing to maximize the revenue from their short-term rentals.
Read on to find out how to use Airbnb analytics and market intelligence tools to gather and analyze accurate data to help you build a successful Airbnb strategy and boost your short-term rental profits.
Airbnb Analytics for Real Estate Investors
Thanks to websites like Airbnb, Vrbo, and Booking.com, many people choose to buy a vacation rental property in an attractive location to rent it short-term and earn passive income. However, while owning a vacation rental can potentially be highly profitable, it’s essential to conduct a thorough analysis before investing.
Then, you’ll be able to find a lucrative property that will pay itself off. But to maximize your profits, you should treat it as a business and provide a perfect experience for your guests. That’s a lot of work, so savvy Airbnb hosts opt for short-term rental software like Hospitable to automate routine tasks and save time.

When starting an STR business, there are several key factors to consider when evaluating a rental property and determining its investment value. So, doing your own Airbnb analysis and estimates can be challenging. Luckily, Airbnb analytics tools like AirDNA, Mashvisor, and Rabbu, among others, obtain data directly from Airbnb and other OTAs, enabling you to make an informed decision.
Key Data is a performance-insight and competitive-benchmarking platform that tracks short-term vacation rental market trends using industry-standard key performance indicators. Key Data helps property managers better understand the short-term rental market, enabling them to operate, grow, and invest with confidence by offering tools to optimize rates, increase revenue, and retain owners, while delivering deep portfolio insights and industry-best benchmarking. Their data is sourced directly from their co-op of millions of vacation rental properties worldwide, OTA’s, and hotels to create market and property-level intelligence for property managers, destinations, hoteliers, and investors.
Mashvisor is an AI analytics platform that can help you find lucrative investment properties in high-demand areas and forecast the profitability and performance of any rental property you’re interested in.
The Heatmap Tool allows you to set filters using such metrics as the listing price, cap rate, cash on cash return, and more to identify areas in the US that meet your criteria.
The Property Finder allows you to explore potential properties in different locations simultaneously and compare such factors as listing price, occupancy rate, rental income, cap rate, and cash-on-cash return.
The Rental Property Calculator can help you estimate revenue potential for each property that looks like a good fit for you.
AirDNA can help you discover the best places to invest in a vacation rental worldwide. It can provide valuable insights into your market’s performance, helping you better understand how the short-term rental industry is evolving.
This Airbnb analytics platform doesn’t have tools to search for lucrative short-term rental properties. However, AirDNA’s Rentalizer allows you to see how a property would perform as a full-time short-term rental if you enter its address. You’ll see the property’s annual revenue, occupancy rates, and average daily rates.
Airbtics provides worldwide short-term rental and real estate data. Their heatmap feature helps you identify high-demand neighborhoods, and their discovery feature helps you find profitable short-term rental markets with high real estate appreciation potential.
Rabbu offers free, useful Airbnb analytics tools for real estate investors who want to discover and analyze STR properties in the US market. They can help you find top short-term rental markets and profitable Airbnb properties.
The Airbnb Calculator enables investors to determine the potential earnings of any address as a short-term rental. You must enter an address and select comparable properties to receive an instant projected revenue estimate. Users can also access information on various metrics, including average daily rate, seasonally adjusted annual revenue, occupancy rate, and RevPAR (revenue per available room).
Airbnb Data provides access to short-term rental data for any market in the US. It can help you conduct market research, identify high-performing markets to invest in, and find ways to make your vacation rental stand out.
Properties for Sale can help you discover new short-term rental investment opportunities. You can search by ZIP code, city, county, or state to find properties that have gone through Rabbu’s initial underwriting and are paired with STR stats, such as cap rate, cash-on-cash, and gross yield. You can also set your preferences to receive custom underwriting for every property.
Airbnb Analytics for Hosts
Monitoring data such as occupancy rates, guest reviews, and repeat guests can help hosts maintain a competitive edge on the platform. You can use this data to create memorable guest stays and maximize your revenue.
Airbnb offers several professional hosting tools that you can access in your Host account to track your hosting success. You can use these tools to
Identify your most successful listing,
Review the historical, real-time, and potential performance of all your listings across key business metrics,
Compare your listing to similar listings in your area
You can search, filter, and compare your Airbnb hosting performance over the past 12 years. You can also include data on upcoming bookings and choose which listings to include using each section’s search and filter bar.
If you go to the Insight section in your account settings, you can access performance metrics in the following areas:
Occupancy and rates—there are four sub-sections where you can review data about your listings’ occupancy rate, cancellation rate, length of stay, and nightly rate. Occupancy rate is one of the most critical performance indicators, as it can show you how your pricing strategy works. If your occupancy rate is significantly lower than the city average, consider lowering your nightly rate.
Conversion—the data in this section provides accurate, real-time information about booking conversion rates, booking lead times, returning guests, listing views, and wishlist additions. Analyzing conversion performance data can help you optimize your listing to make it more attractive to guests and convert page views into bookings. You can add professional photos that showcase your listing's best features, highlight high-end amenities, and adjust your prices accordingly.
Hosting progress—here, you’ll find data that can help you go further in your hosting business. This section shows your current status and what you need to do to meet the criteria for participation in the Superhost program.
Earnings—in this section, you get a full overview of your earnings, breaking them down into metrics such as average nightly revenue, total nightly revenue, and cancellation fees. You can check your income for the year or by month. That might help reveal patterns or seasonality for your short-term rental property.
Quality—data in this section can help you adapt to your guests’ preferences. It aggregates the number of 5-star ratings you receive from guests in their reviews across categories such as location, value, accuracy, amenities, cleanliness, communication, check-in, and overall experience. You can improve your Airbnb rating by accurately describing your property, providing a listing that meets a high standard of cleanliness, and responding quickly to guest messages before and during their stays.
But what if you list your properties on more than one platform? You will need a tool to see the big picture of your performance across channels and compare their efficiency.

How Hospitable Helps Hosts with Analytics and Reporting
Hospitable offers an all-in-one dashboard that allows you to analyze and export financial and operational data for every booking on Airbnb, Vrbo, Booking.com, and your direct booking website. You can:
Monitor the health of your rentals
Analyze financial data
Dive deep with filtering
Save filtered dashboards for quick access
Create public views of the dashboards to share with your team without needing them to log in.
You may also want to check out our guide to learn about Airbnb metrics and KPIs every host should monitor.
Hospitable users on the Mogul plan can easily get actionable insights using Copilot. It’s an AI assistant built into Hospitable that helps you manage your properties and operations more efficiently, providing analysis and guidance.
You can use Copilot to analyze key business metrics, such as occupancy, length of stay, revenue, and guest origins, which will help you make informed decisions to optimize bookings, finances, and marketing. Copilot can also access operational data to provide you with insights into tasks and team coordination. It may give you improvement suggestions based on guest reviews.
Ask Copilot a specific question related to your STR business, and it will analyze your query and your account’s business data. Your AI assistant will instantly provide a meaningful answer, saving you time. You can ask follow-up questions to get more detailed information.
Note that the more you interact with your personal AI assistant, the better it will understand your needs and provide more relevant answers. And we’re constantly working at expanding its capabilities.
Watch this interactive demo to get a better idea of how you can work with a Copilot.
Hospitable has an MCP server feature available to users on most plans. Hospitable MCP allows AI tools like ChatGPT or Claude to securely access your Hospitable account and work directly inside it. You can use Hospitable’s MCP server to connect AI systems of your choice, give them access to data, and allow taking actions across all your connected channels, including bookings, calendars, tasks, reviews, guest conversations, financials, and more, and run your business with simple prompts.
For analytics, MCP lets you use AI to retrieve and analyze your data and visualize the numbers that matter to you, the way you like. Just describe your dashboard needs to your AI, and it will build it for you. For example, you can display a single live KPI full-screen, put together a multi-page executive report that includes key metrics and breakdowns, or build an interactive operational dashboard that provides suggestions on what you can do next.
With Hospitable’s MCP, your AI tools aren’t limited to reading data. They can also take action in your account on your behalf, like sending messages directly to guests, blocking dates in your calendar, or updating prices. With MCP, you can use AI agents to build automations tailored to your business needs and turn everyday actions into automated workflows.
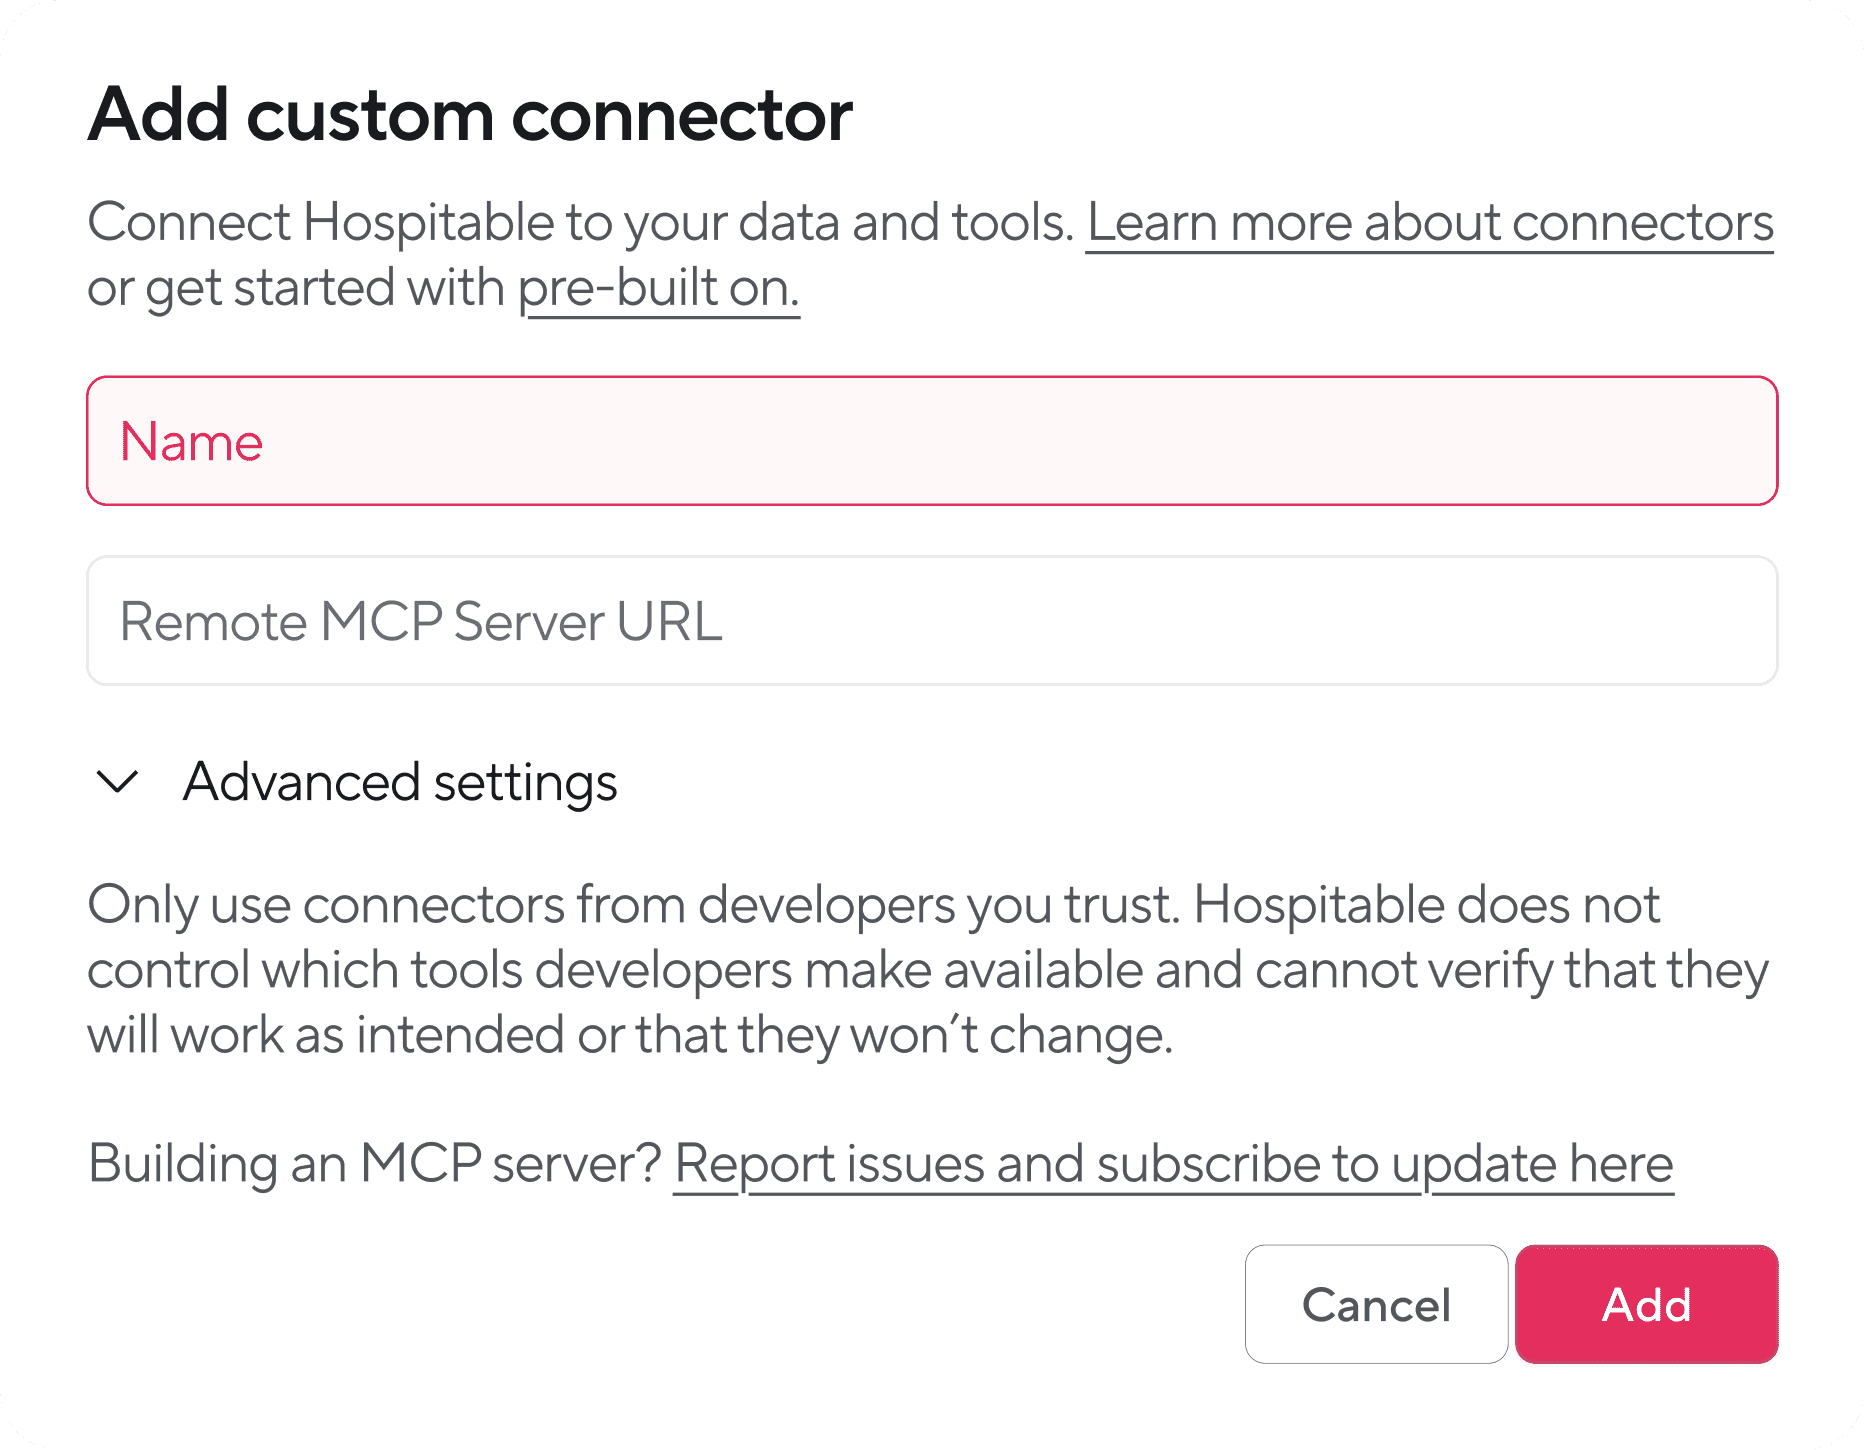
Connecting an AI agent to your Hospitable account takes a couple of minutes and doesn’t require any technical skills. Add Hospitable’s MCP server URL to the AI agent you already use, sign in with Hospitable, and authorize access.
Once connected, your AI agent can operate within your Hospitable data environment, so you can describe what you want, and your AI will do it. You’re always in control of what the AI agent can do in your account, and you can revoke access at any time.
So you may be wondering what people are building using Hospitable MCP? Here are two real-world use cases.
A weekly pacing report on autopilot. A property manager described to AI the insights they want to see every Monday morning, and now they receive a weekly report with no manual effort. A three-page report provides a comprehensive snapshot of their portfolio performance this year, comparing it to the same point last year. It includes up-to-date information on adjusted revenue, bookings on the books, reserved nights, lead times, platform mix, RevPAN ranking, and an executive summary highlighting what is growing and what needs attention.
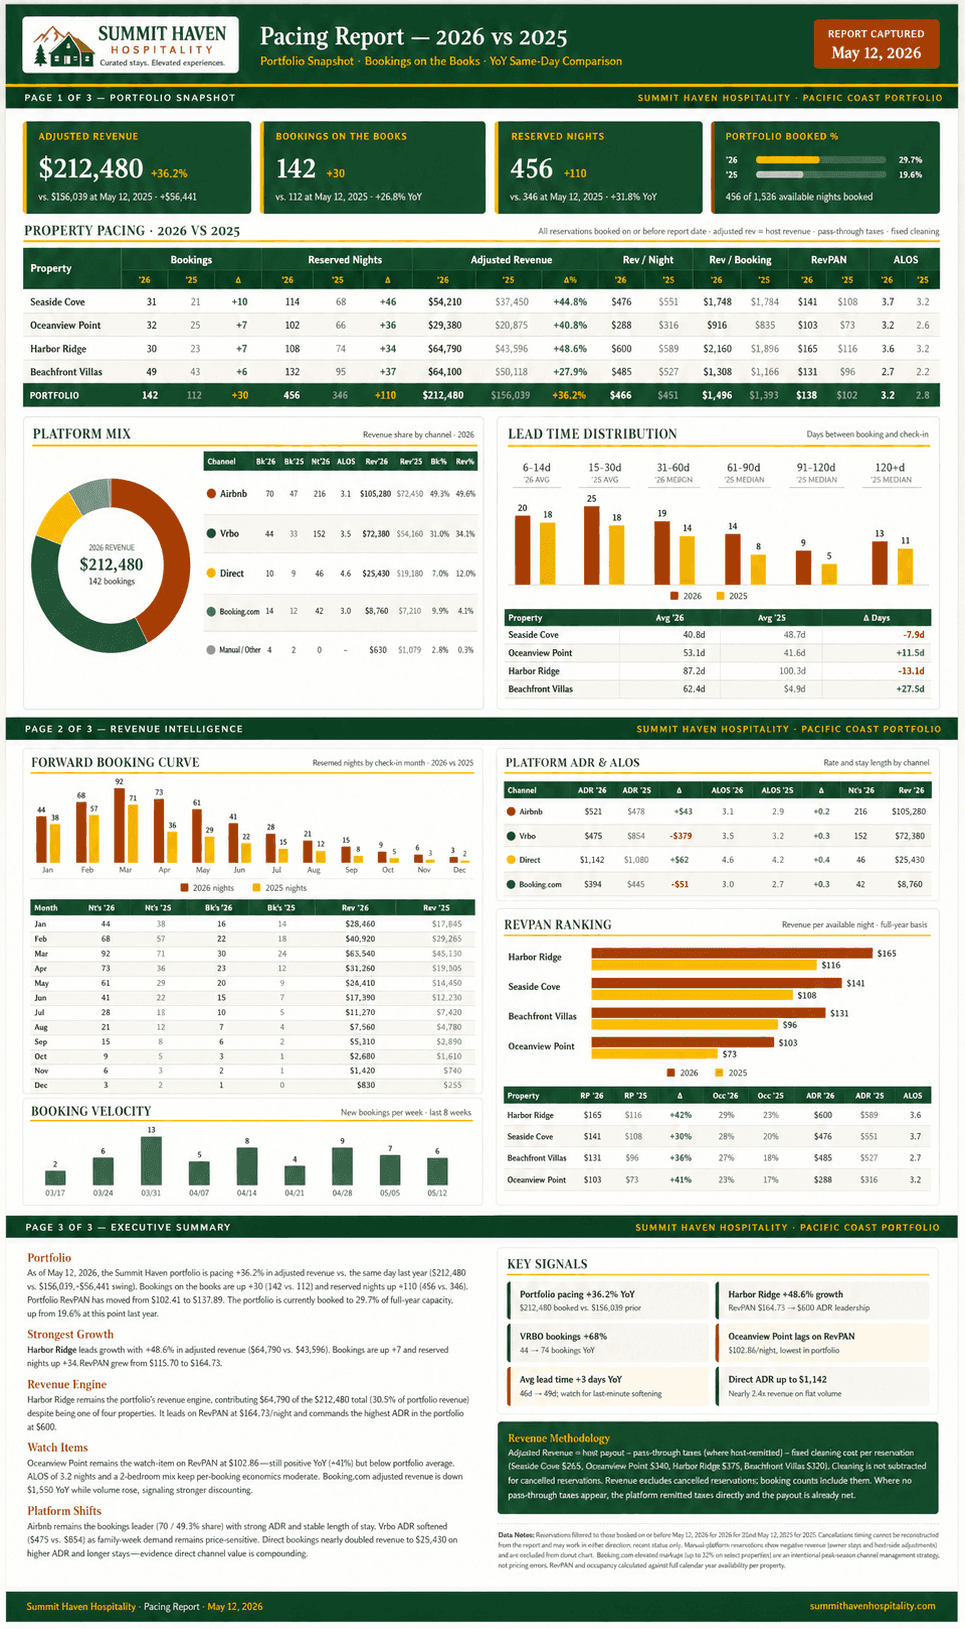
Real dashboard. Brand name and numbers changed.
An interactive operational dashboard. Another property manager built a dashboard to track day-to-day business activities and key performance metrics, providing a real-time view of their operations. The dashboard goes beyond displaying important data. Every problem cell includes a button with a recommended action, helping to solve problems quickly as they arise. For example, unanswered messages include a Reply now button, and pricing suggestions include the suggested nightly rate and an Apply change button next to it. The AI pulled data from Hospitable, analyzed it, and did the triage. It’s up to the user to decide which actions to approve, and when it happens, the changes are pushed to every channel.
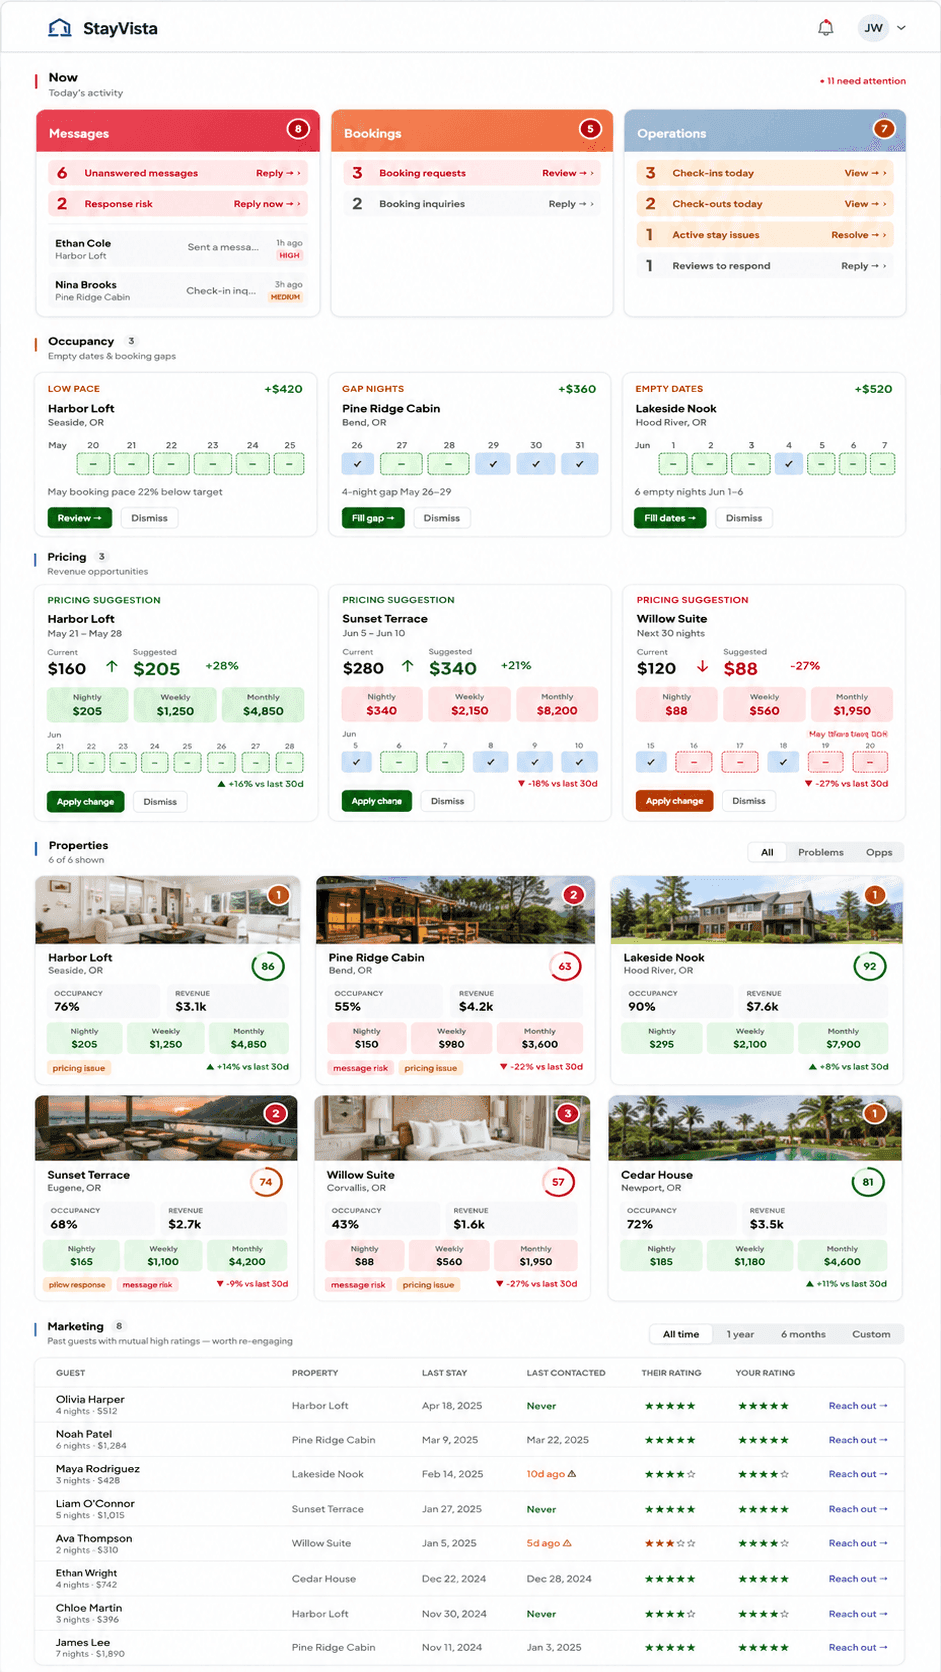
Real dashboard. Brand name and numbers changed.
You may also want to check out our blog to learn more about using AI for vacation rentals and property management tasks that AI handles effectively.
Final Thought
Airbnb analytics tools can help you obtain the most accurate data, allowing you to evaluate different rental properties objectively. You can use them to identify the best short-term rental markets and search for the most profitable properties within your preferred locations and neighborhoods.
Tracking Airbnb analytics for hosts is critical to managing your vacation rental business. A data-driven approach will help you identify problem areas in your STR strategy and determine how to address them effectively. You can use this data to optimize your listing and ensure you meet your guests’ expectations as best you can. This way, you can increase your chances of ranking higher in search results and get more bookings.


Table of contents
Common questions
What is Airbnb analytics?
Airbnb analytics is the process of collecting and analyzing data related to your vacation rental business to make better operational and financial decisions. This can include metrics such as occupancy, revenue, nightly rates, booking conversion, guest reviews, cancellation rates, and guest behavior. By tracking the right data, hosts can identify trends, optimize pricing, improve guest experiences, and uncover opportunities to increase profitability. A data-driven approach removes guesswork and helps hosts make decisions based on actual performance.
What are the best Airbnb analytics tools?
The best Airbnb analytics tools depend on what you're trying to achieve. Investors often use platforms like AirDNA, Mashvisor, Rabbu, Airbtics, and Key Data to evaluate markets, estimate revenue potential, and compare investment opportunities. Hosts and property managers need a different type of analytics. Airbnb provides basic performance reporting for individual listings, but multi-channel operators often need broader visibility. Hospitable combines financial, operational, and channel-level reporting across Airbnb, Vrbo, Booking.com, and direct bookings in a single dashboard, making it easier to understand overall business performance.
How can AI improve Airbnb analytics?
AI improves Airbnb analytics by helping hosts understand their data faster and uncover insights that might otherwise be missed. Instead of manually filtering reports and comparing metrics, hosts can ask questions in plain English and receive actionable answers instantly. For example, Hospitable’s Copilot can analyze occupancy, revenue, booking trends, guest origins, operational performance, reviews, and team activity. It can also provide recommendations and answer follow-up questions, helping hosts spend less time analyzing spreadsheets and more time acting on insights.
Can AI build custom Airbnb dashboards?
Yes. Modern AI tools can build fully customized dashboards based on your specific business needs instead of limiting you to predefined reports. Using Hospitable MCP, hosts can describe the dashboard they want in plain language, and their AI agent can generate it automatically. This can range from a simple dashboard displaying a single KPI to a multi-page executive report or a real-time operational dashboard tailored to the metrics that matter most to the business.
Can Airbnb analytics tools take action automatically?
Most analytics tools stop at reporting. They help you understand what is happening but leave the next steps to you. With Hospitable MCP, analytics can go a step further. Connected AI tools can not only analyze bookings, revenue, reviews, guest messages, and operational data, but also take actions inside your account. For example, they can send guest messages, block dates, update prices, and trigger custom workflows based on the insights they discover, turning analytics into operational automation.